Publications
The following papers have been produced using SugarCaneModel and are available for download below.
May 2014: "We don't know everything: modelling the sugar industry and decision-making in an uncertain world." Presented at the annual congress of the Sugar Institute of Technologists, Toronto, Canada.
June 2013: "The variability and drivers of the carbon footprint of cane sugar". Presented at the congress of the International Society of Sugar Cane Technologists, Sao Paola, Brazil. (Winner of the H. William Kerr award for best paper in the Management Commission and republished in the International Sugar Journal, November 2013).
Sep 2012: "The application of rigorous modelling
with Monte Carlo simulation methods to assist decision-making in sugar
factories" (English version). "Aplicación de un modelo riguroso con métodos de
simulación Monte Carlo para ayudar en la toma de decisiones de inversión en
fábricas de azúcar" (español). Presented at the congress of Atalac-Tecnicana society in Cali, Colombia.
Example Case Study
This section is intended to give an overview of a typical application for which SugarCaneModel can be used. The example is fictional, and any values presented are not intended to be accurate.
The starting point for the case study is that there is a sugar factory in Mexico processing 10,000 tonnes per day of cane into raw sugar for local consumption and export. The factory owners are considering investment in one of the following three areas:
1) Installation of a white-end refinery to provide refined sugar for local market.
2) Improvement of energy efficiency and installation of cogeneration facilities.
3) Installation of a distillery to process molasses into ethanol.
The owners are faced with a decision: which (if any) of the three potential options should they progress with? The following illustrates how SugarCaneModel can be used to assist with their decision.
Modelling the Existing Factory
The first step is to model the existing factory. In SugarCaneModel this is carried out in three steps:
Configuring the model (e.g. specifying which factory processes are included). This is based on basic knowledge of the existing factory, which can often be acquired from a distance.
Populating the Economic Dataset (e.g. specifying the price for utilities, products, etc). This requires estimation of current and future costs and prices. Current costs and prices can normally be obtained from factory personnel. Potential future variations (required for Monte Carlo simulation) can be obtained from (a) published forecast data such as World Bank forecasts for sugar prices or US government forecasts for energy prices, (b) historical data such as chemical prices or world raw sugar prices (probability distribtions can be generated from historical data), (c) expert or general opinion, or (d) a combination of the above.
Populating the Technical Dataset (e.g. specifying the performance of processes). This involves amending the Default Technical Dataset to match the performance of the existing factory. The data required can usually be obtained from factory records. Ranges of values will be included for key parameters (such as sucrose extraction or bagasse moisture) for the purposes of Monte Carlo simulation. The ranges can be defined from historical data or from expert opinion from factory staff. For some of the required inputs data will not be available, and values from the Default Dataset can be used instead.
The screenshots below illustrate how the data is entered into SugarCaneModel:
The next step is to run the model and view the results. There are different levels of detail in which the results can be viewed; in this case, it is important to check that the outputs from the model match the outputs from the actual factory. This can be checked by viewing the financial summary, flowsheet, and key stats sections. Excerpts from these sections are shown below.
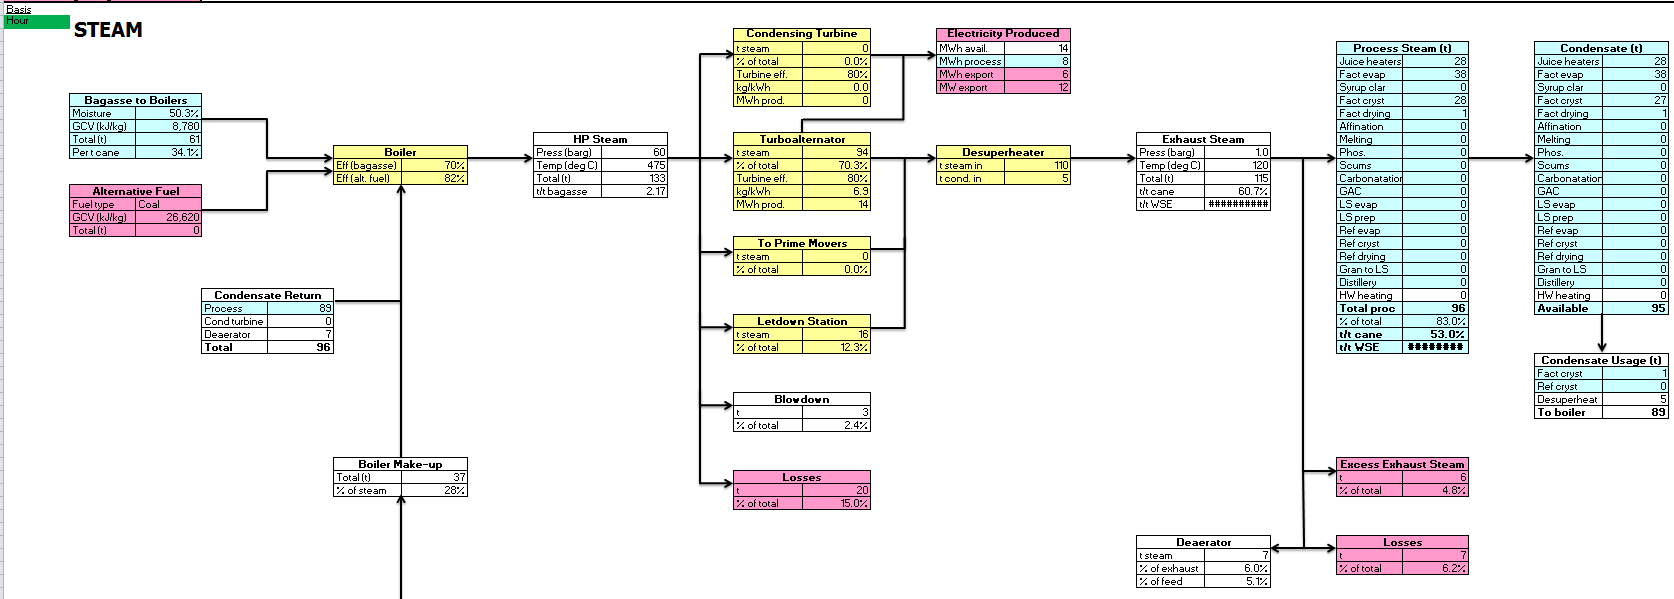
If the output data is significantly different to the actual factory data, then the Technical Input dataset can be amended accordingly. If the output data provides a reasonable match, then the factory model is complete and the three options for investment/expansion can be considered. This will be carried out by running two models in parallel: the first, which has been created above, represents the existing factory; the second will represent the existing factory plus the changes or additions involved in each of the three options. This is easily done in SugarCaneModel: clicking the "Create Parallel Model" button will create a copy of the existing model and display the two models side-by-side.
The second model now needs to be configured to represent the particular option. The first option under consideration is the white-end refinery.
Option 1: White-End Refinery
The process for setting up the white-end refinery model is similar to that carried out on the factory model:
Configuring the model (e.g. specifying which refinery processes are included). The optimium process configuration for the refinery may not be known at this stage. In fact it is likely that SugarCaneModel itself will be used to determine the optimum configuration, so at this stage the anticipated configuration would be entered. Of particular importance is the amount of sugar diverted to the white-end refinery. In some situations this might be 100%. In others the amount might depend on the local or export market demand, or the relative prices of raw or refined sugar. SugarCaneModel can actually be used to optimise the value under varying conditions.
Populating the Economic Dataset. The economic dataset will basically be as per the factory model, except that there is now capital expenditure involved. The CAPEX value for the white-end refinery can be entered if known, or it can be automatically estimated based on previous similar projects and processes, using scaling factors and plant cost indices. A +-% uncertainty value will be entered, as will the estimated range for discount rate on capital.
Populating the Technical Dataset (e.g. specifying the performance of processes). The data entered here would reflect the anticipated performance of the refinery processes. For the majority of the data values from the Default Dataset would be used, which are based on general industry process performance, but any parameter can be amended where required.
The screenshots below show examples of this process for the white-end refinery.
Now both models can be run in parallel and the results can be inspected. As before, the sections of most interest are the financial summary, flowsheet and key stats sections. The financial summary now has an extra section showing the differential between the two models, i.e. the impact of installing the white-end refinery.
There are many aspects of the results that we could investigate in more detail, such as effluent discharges, sustainability, impact on utilities or OPEX, but for the purposes of this example we will focus on profitability, i.e. we have decided to base our decision purely on the relative profitabilities of the three options. The following diagrams show the probability distributions of annual profit, payback, Net Present Value (NPV) and Internal Rate of Return (IRR), together with a summary table. Note that annual profit is calculated after deducting the cost of capital on an annualised basis, and NPV and IRR are calculated over 20 years.
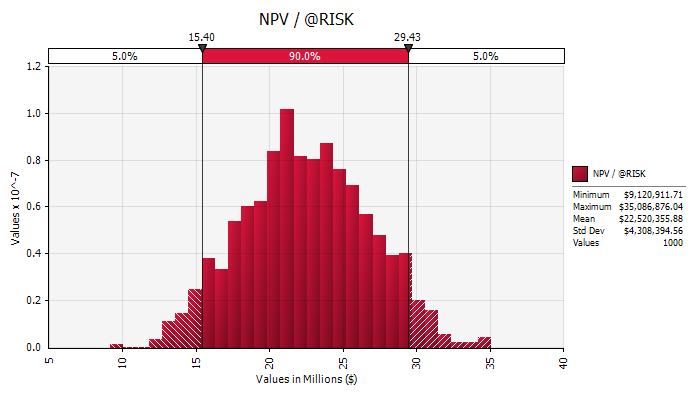
We can see from these outputs that on average we expect an annual profit of $2.6m, an NPV of $22.5m, a payback period of just under 5 years and an IRR of 19.8%. Importantly, we can also see the potential variability in these parameters. For example, there is a 5% probability that the NPV will be less than $15.4m (this is commonly known as the "Value at Risk").
There are a number of different exercises we could now carry out with respect to the white-end refinery. We could use the model to compare different process configurations for the refinery, such as comparing ion exchange with carbon for decolourisation. We could view the sensitivity analysis for profitability to see where the main risks and opportunities lie and, if practical, we could mitigate the risks or take advantage of the opportunities, and re-run the simulation to see the effects. We could also stress-test the model against different scenarios, to see the effect on the white-end refinery of improved factory operation, for example. In reality we would probably investigate some or all of these possibilities, but for the purposes of this example we will leave the white-end refinery for now and move on to option 2, the cogeneration plant.
Option 2: Energy Efficiency and Cogeneration
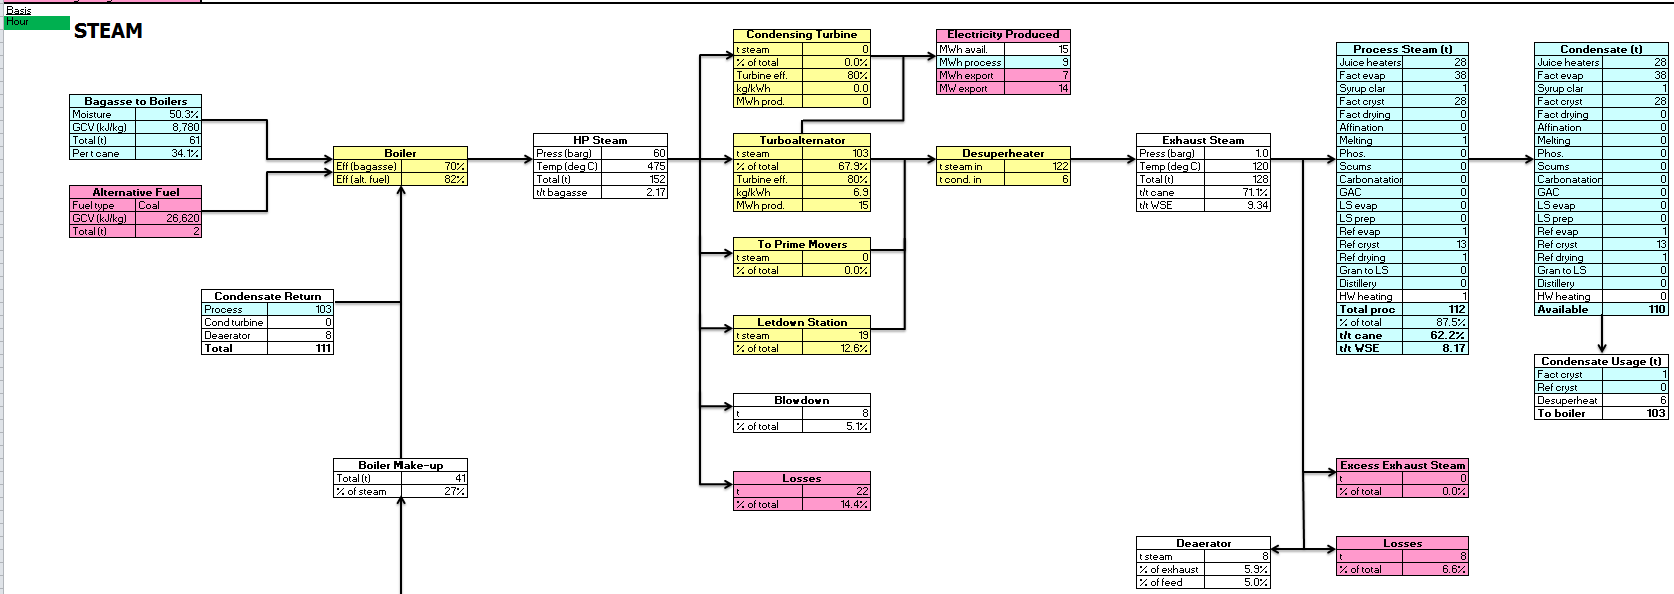
The process for modelling the cogeneration option is as before: we create a parallel model of the existing factory and modify it to represent the energy efficiency improvements and cogeneration installation. This would probably include specifying or optimising vapour bleeding for improved steam economy, reducing heat losses and boiler blowdown, adding a condensing turbine, etc. Again, key values will be defined by ranges representing the uncertainty in process performance, operability, etc. Once the cogeneration model has been set up, both models can be run in parallel and, as before, the results can be inspected. The screenshots below show the financial summary, which indicates the expected impact of the changes on the profit and loss, and a side-by-side comparison of the utities section of the Key Stats, which indicates, for example, the impact on steam-on-cane values and elecricity generation.
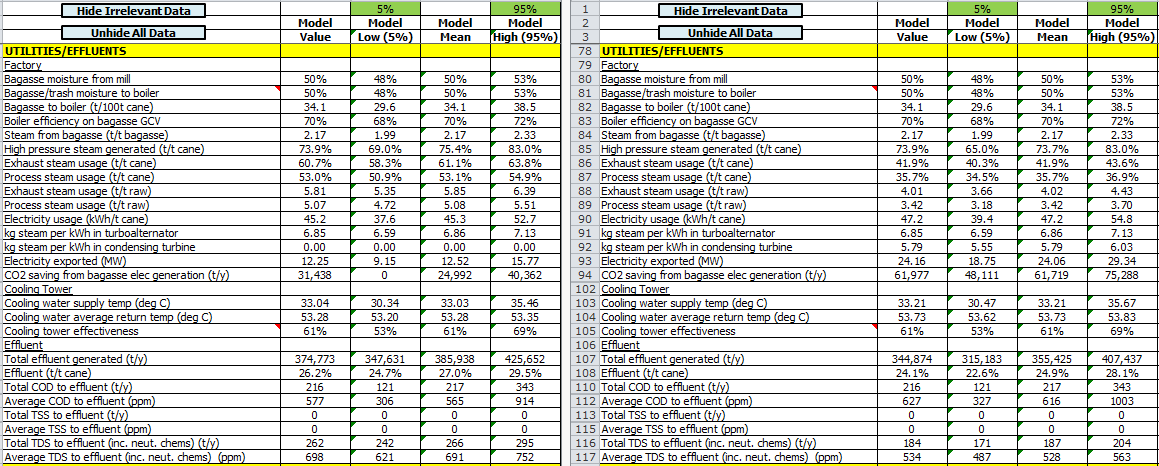
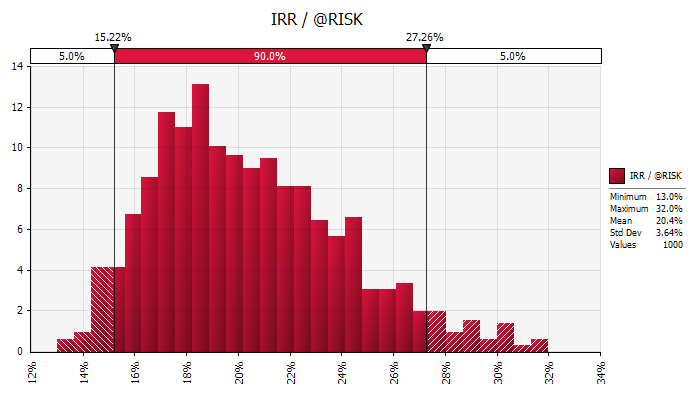
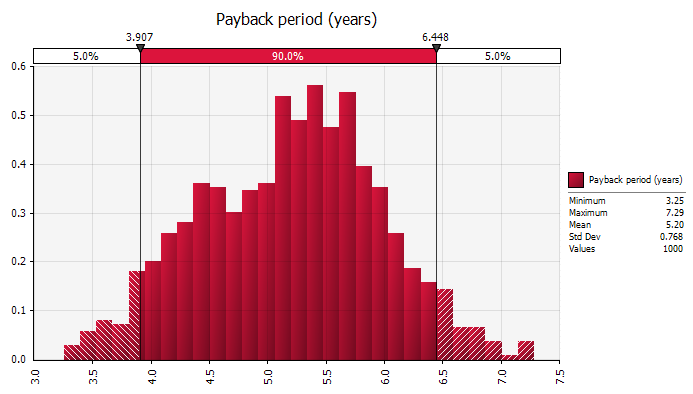
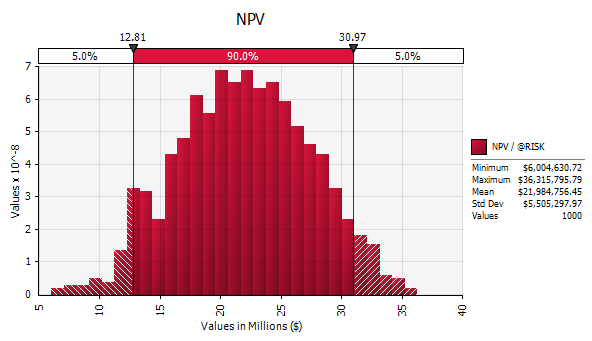
In order to compare against the white-end refinery option, we can also view the distributions and data for profit, NPV, payback and IRR:
For the cogeneration option, we expect an annual profit of $2.8m, an NPV of $25.5m, a payback of 5.2 years and an IRR of 20.4%. The NPV "Value at Risk" is $17.5m. Comparing with the values above for the white-end option, we can see that for all measures except payback, the cogeneration option appears to be more attractive than the white-end option.
Option 3: Distillery
Lastly, we will consider the distillery option. As before, we create a parallel model of the existing factory and modify it to include a distillery processing the molasses, which previously was sold, into ethanol. The steps for specifying the model are the same, but in this particular example there is an extra consideration at the model configuration stage. The vinasse (the waste product from the distillery) is to be used for fertilisation on the cane fields, incurring a cost for transport but a revenue in terms of reduced fertiliser requirement. However, a key risk has been identified: it is possible that in order for an environmental consent for this practice to be obtained, the vinasse must be first concentrated to increase its solids content. At this early stage of development of the project, it is considered that the risk, which will affect capital and operating cost, carries a 50% possibility of occurring. This risk will be built into the model by modelling it as a discrete probability distribution.
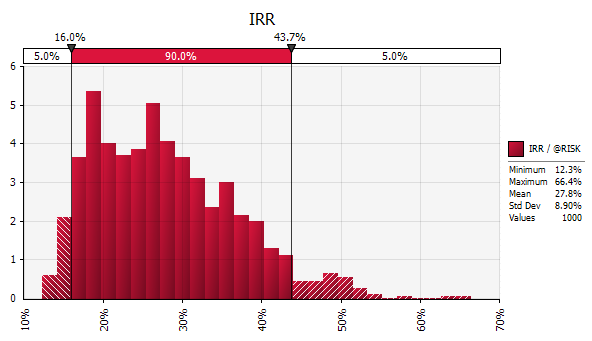
Once the model setup is complete, both models will be run in parallel and the results can be inspected. To compare against the previous two options, we will again view the distributions and data for profit, NPV, payback and IRR:
For the distillery option, we expect an annual profit of $2.4m, an NPV of $22m, a payback of 5.7 years and an IRR of 27.8%. On all measures except IRR, the distillery is less attractive than the white-end refinery and hence the worst of the three options, although the difference is again relatively small. We can also see, however, that the spread of outcomes for the distillery option is significantly larger than for either of the other two options. For example, the profit distribution shows a small (>5%) possibility of the distillery being loss-making, while the NPV "Value at Risk" is $12.8m, considerably lower than for the white-end ($15.4m) or cogeneration ($17.5m) options. To determine what is driving the greater variability, we can inspect the sensitivity analysis chart for profit:
This clearly shows that the biggest risk/opportunity is the ethanol price. The second largest risk is the molasses price, closely followed by the risk that a vinasse evaporator is required. One option here is to investigate further to see whether the risks/opportunities identified above can be mitigated, removed or taken advantage of. We can judge how worthwhile this activity might be by looking at the potential upside. For example, if the NPV values at the right-hand-side of the distribution (above the 95th percentile) are significantly higher than for the white-end or cogeneration options, the potential upside might be worth exploring further. In this case, we can see that the 95% NPV value is $30m for the distillery, compared with $29m for the white-end refinery and $35m for the cogeneration option. As a result, we would probably judge it not worth exploring further.
Another potential avenue to explore would be to use SugarCaneModel to assess the benefits of the distillery as part of an overall strategy to minimise risk to volatility in sugar, ethanol and molasses prices. However, for the purposes of this example we will not consider the distillery option further.
White-End versus Cogeneration
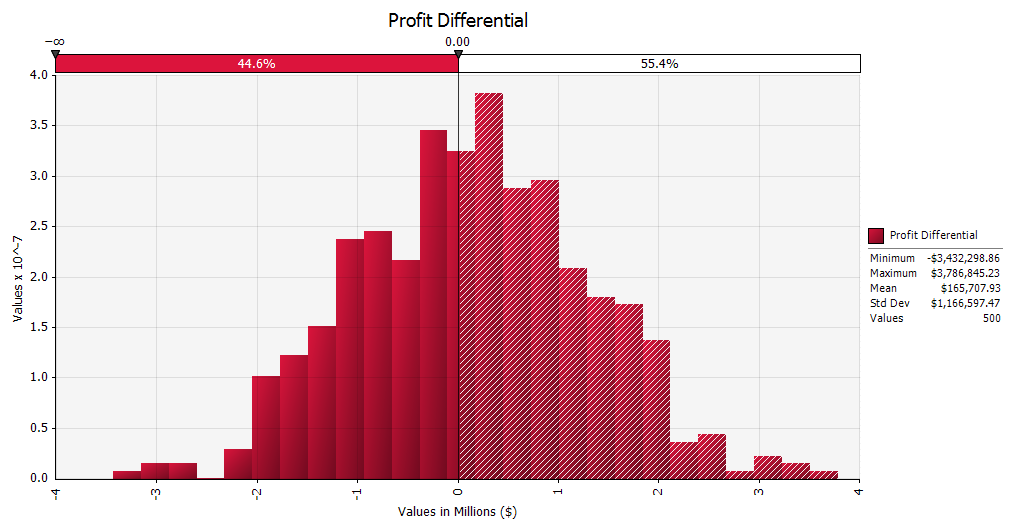
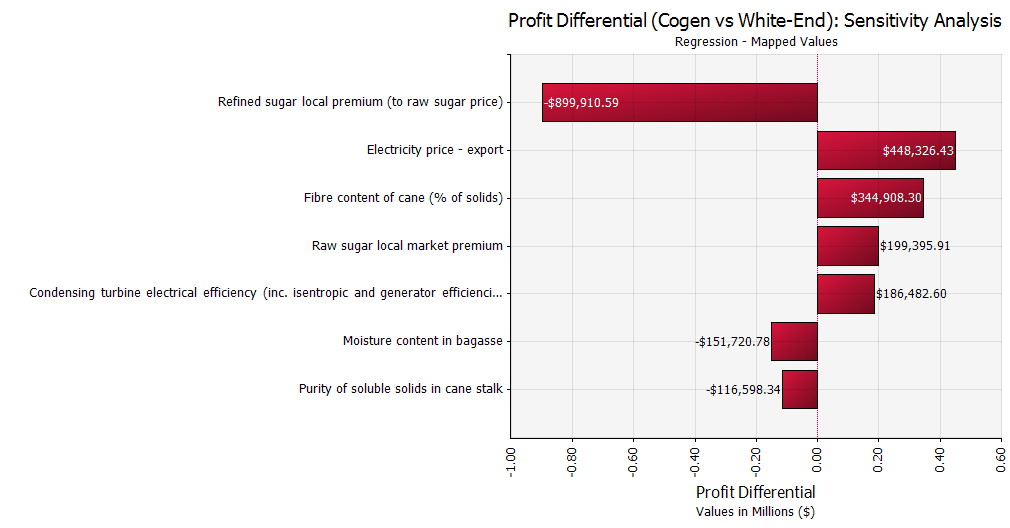
This leaves us with the white-end refinery and cogeneration options. We have identifed that cogeneration is expected to be slightly more beneficial than the white-end refinery, so we could progress on that basis. Alternatively, we could compare the options against each other to investigate how clear-cut the decision is, and what factors are driving it. To do this we would run in parallel the two models we created earlier, and inspect the probability distribution of the differential in profit between the two models, and the sensitivity analysis chart for that differential.
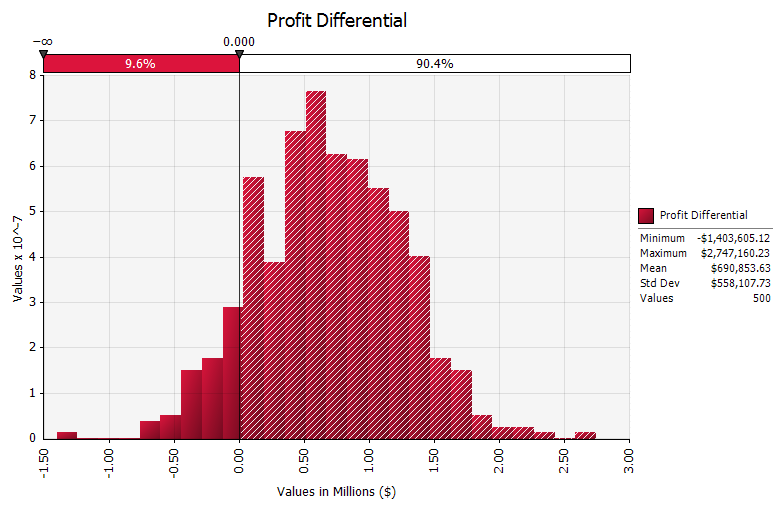
We can see straightaway from the probability distribution that the decision is not clear-cut. In fact, there is a 45% probability that the white-end option would actually be more profitable. On this basis, it would be difficult to make a decision to disregard the white-end option at this point. Instead, we can look at the sensitivity analysis chart to see what parameters are driving the decision. We can see that the two biggest drivers are the refined sugar premium and the electricity export price, followed by the fibre content of the cane. Therefore we know that we should focus on reducing the uncertainty in these parameters in order to come to a decision. Let's suppose that we obtain agreement from the government on fixed prices, or price bands, for refined sugar into the local market and electricity to the national grid. We can then update the model with these new values, re-run the simulation, and view the updated probability distribution.
Conclusion
We can now see that as a result of adopting the price agreements, the probability of the white-end option being more profitable has been significantly reduced, to <10%. On this basis, we will progress the cogeneration option and drop the white-end and distillery options. We can make this decision - both rigorous and auditable - confidently, having assessed the scenarios holistically and taken into account the effects of uncertainty.
As stated earlier, this example is fictitious and any values used are not intended to be wholly accurate. It is intended to illustrate a number of ways in which SugarCaneModel can be used to assist in making decisions. The applications page lists other examples in which SugarCaneModel has been and potentially could be used.