Monte Carlo Simulation: a Simplified Illustration
Monte Carlo simulation is a computerised mathematical technique that furnishes the decision-maker with a range of possible outcomes and the probabilities that they will occur for any choice of action. The technique was first used by scientists working on the Manhattan Project, and is used today in areas including finance, project management, energy, manufacturing, engineering, research and development, insurance, oil & gas, transportation, and the environment. The method can be described as comprising the following basic steps:
- Replace any input parameter which is subject to inherent uncertainty with a range of values, represented by a probability distribution.
- Recalculate the model over and over again, each time using a different set of random inputs as sampled from the probability distributions.
- Aggregate the results from each recalculation and generate probability distributions for each output value.
The method can be illustrated by the following simplified example. Suppose we are contemplating constructing, or investing in, a new autonomous sugar refinery. At the initial stage of this potential project, we estimate a refining cost of $45/t, a refining margin of $80/t, a CAPEX of $200m, a production rate of 1,000,000 tonnes per year, and a discount rate on capital of 8%. Using these figures we can carry out a simple cash flow analysis. To keep things simple for the example, we will assume that (a) all the CAPEX is expended in year 0, (b) the refinery will be in full production from year 1 onwards, and (c) our estimated values above will apply for each of the first 10 years of production. The cash flow analysis then looks like this:

The results show an estimated payback of 5.7 years, NPV of $32m, and IRR of 11.7%. Now it's decision time. Do we proceed beyond the initial stage of the project? In this example, we will assume our criteria for proceeding is an expected NPV of greater than zero. On this basis, therefore, we would proceed.
Alternatively, we could put the decision on hold and explore the possible variations in the outputs, i.e. the payback, NPV and IRR. Up to this point our model – which in this simplified example is a basic calculation – is static, with single-point estimates for input data. As the decision is an important one, we might decide to test the model using three-point - worst case, expected and best case - estimates instead of the previously used single values. As is common in most models, we were probably conservative with the single-point estimates. For the refining cost, we might actually expect a value of $40/t, with $35 and $50 as the best and worst case. The CAPEX might include 10% contingency and a confidence level of +-30%. We might expect the production rate to vary by +-10%. For the refining margin, we might decide to take the minimum, average and maximum values for world white premium over the last 10 years: $58/t, $73/t and $97/t.
Using these figures, we can re-run the cash flow analysis and obtain expected, best and worst case values for payback, NPV and IRR:

What does this tell us? That the expected case is slightly better than the original single-point estimate, but that there is a huge range of potential outcomes. The best case is highly attractive, with an NPV of $350m, while the worst case, with an NPV of -$170m, fails our criteria for proceeding. Do we cancel the project on the basis of the potential downside? Or do we proceed on the basis of the potential upside?
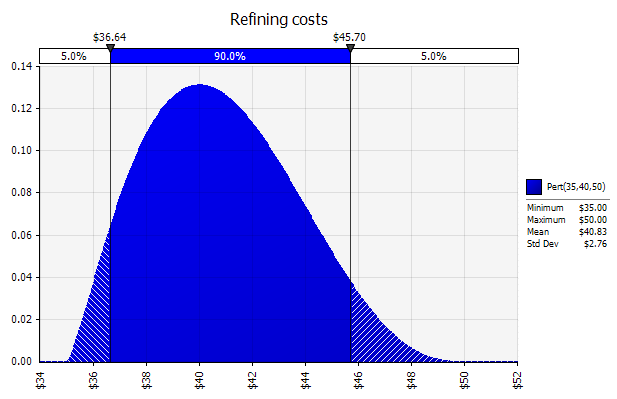
What we really need to know is the probability of the upside and downside occurring. To obtain this, we turn the model from a static to a variable one, using Monte Carlo simulation. Firstly we replace the five inputs (refining cost, refining margin, production rate, CAPEX and discount rate) with probability distributions. There are various probability distributions we could use (common distributions include normal, lognormal, uniform and triangular) but in this scenario we will use the PERT distribution for each input. The PERT distribution was developed to model expert estimates, and requires three values for its definition: minimum, most likely and maximum. Its shape reflects the greater likelihood of values occurring in the region around the most likely value. We will use our three-point estimates from earlier to define the distributions. The chart below shows the distribution for refining costs. The vertical axis represents probability, so this distribution indicates that there is a greater probability of values occurring around the $40 mark. The vertical bars highlight the 90% confidence band: in this case, there is 90% probability that the value will lie between $36.64 and $45.70.
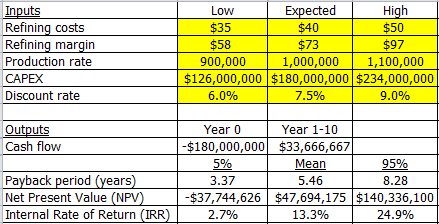
Having defined our distributions for each input in this way, we then recalculate the cash flow analysis 1000 times. For each recalculation, the values for our five inputs will be set by sampling randomly from the probability distributions, and the outputs from each recalculation will be compiled into probability distributions. The cash flow analysis is shown below. The low, expected and high values for the inputs are shown. The outputs (payback, NPV and IRR) are shown in terms of mean and 90% confidence level (i.e. there is 90% probability that the actual value will lie between the 5th and 95th percentiles).
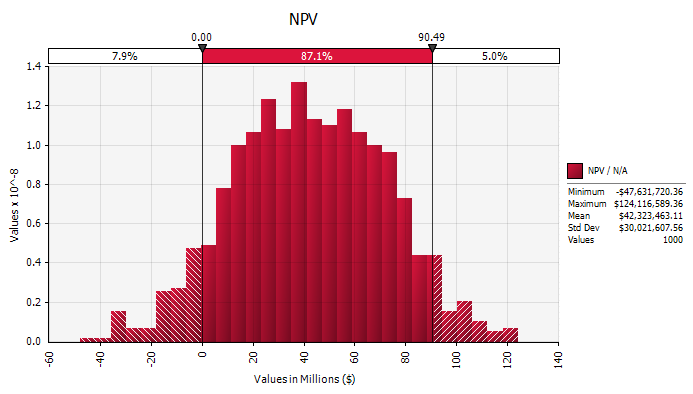
This gives us an idea of the potential spread of values for payback, NPV and IRR. We can also look in more detail at the probability distribution for each output. For example, here is the distribution for NPV:


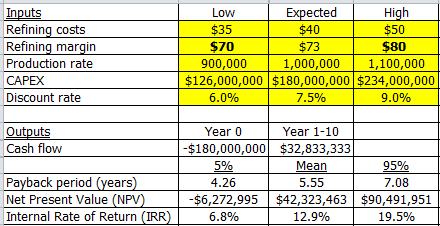
This shows that the refining margin is the biggest risk/opportunity. We might therefore decide to operate some form of hedging against this value. Let's suppose we can hedge so that in effect the margin is limited to within $70/t and $80/t. We can update the probability distribution with these values and re-run the simulation. The revised cash flow calculation and probability distribution for NPV are shown below.