Example Outputs
This page contains examples of the type of data available from the model. Click on any picture to enlarge, and click on the top-right or top-left of the enlarged picture to scroll.
Technical Data
The technical detail of the model can be viewed via the stream tables, energy, water and effluent balances, and flow diagrams.
Economic Data
The results include breakdowns of production costs, CAPEX and labour, a profit-and-loss summary and cash flow analysis.
Key Performance Statistics
Selected parameters are summarised in the Key Performance Statistics section. This allows the model results to be compared against industry benchmarks and expectations. The use of Monte Carlo simulation allows the parameters to be expressed as a range. In the examples below, the mean, 5th percentile and 95th percentile are shown. This provides visibility of the expected range of performance, rather than relying on one fixed expected value.
Probability Distributions
Any output from the model (i.e. any single cell containing a calculation result) can be viewed as a probability distribution. This provides an intuitive visualisation of the estimated variability of the output. Vertical bars highlight the confidence levels (e.g. 90% confidence range) and the probability of exceeding a specific value.
Sensitivity Analysis
Similarly to probability distributions, any output from the model can be analysed in terms of its sensitivity to variations in input parameters. This highlights where the biggest risks/opportunities lie, and in tandem with the probability distributions provides a powerful tool. For example, the probability distributions might show a larger potential variability in an output (e.g. profit, or effluent volume) than would be preferred. Inspection of the sensitivity analysis charts will highlight which input parameters (e.g. feed sugar quality, white premium) have the most effect on the output. Action can then be taken to reduce the variability of these parameters (e.g. restricting feed sugar specifications, hedging against white premium). The model can be resimulated with the reduced variability and the probability distributions reviewed to see whether the variability in the output has been reduced to within reasonable bounds.
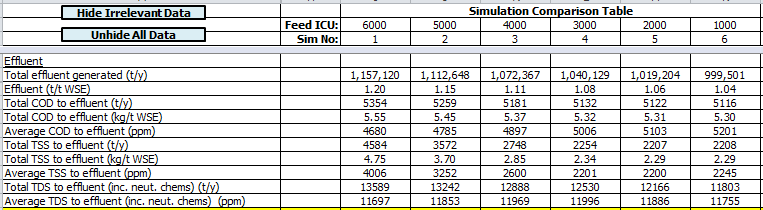
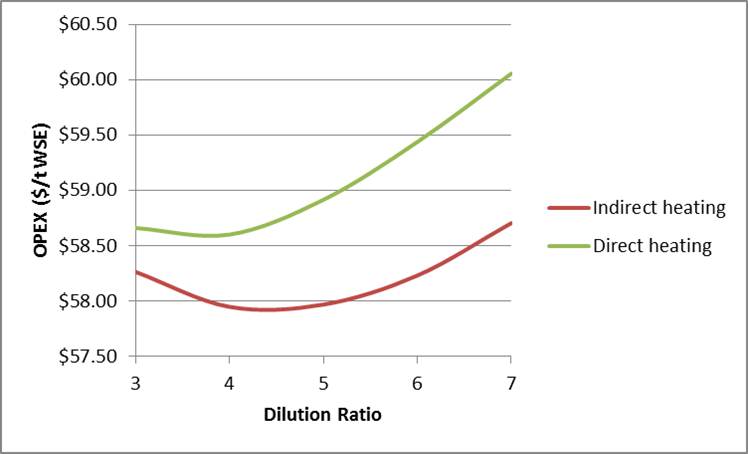
Advanced Sensitivity Analysis
Multiple simulations can be run in series to focus on the effect of a particular parameter. The model automates this task, and incorporates a simulation comparison table where the key performance statistics for each simulation are displayed. Charts can be displayed highlighting the relationship between inputs and outputs, and allowing for optimisation where applicable. Stress analysis can be carried out, whereby a simulation is performed using only high or low values for a specific parameter(s), and the results compared to the normal simulation. This provides visibility of extreme scenarios, such as poor feed quality, low sugar prices, poor process performance, or high shipping costs.
Miscellaneous Outputs
In addition to the examples shown above, the results can be visualised via any of the charting options in Excel and @RISK.